Mango Leaves

Ornamental Plant Leaves

Indian Tree Leaves
We also enhance the images as to make the classification process easier. Discussed in the previous activity, we used the Gray World Algorithm in white balancing our images. For each class, we divided it into two groups: the training set and the test set. We use the training set to get the characteristic features of the leaves that would easily differentiate it from the other class. In this case, we used the RGB values and the eccentricity of the shape of the leaves as our four distinguishing features. Below is a table showing the four features corresponding to each of the 15 training set. This would be our matrix x.

We further group this matrix into their corresponding class: x1, x2, and x3.
x1:

x2:

x3:

We take the mean (u1, u2, u3) for each of these three matrix as well as the mean (u) of the entire matrix x. We then create the mean corrected (x1', x2',x3') matrix given by: xi'=xi-u for i=1,2,3.
We now compute for the covariance matrix given by: Ci=(xi'*xi)/ni for i=1,2,3 where ni is just the total number of trial images for class i. We further compute for the covariance matrix of the entire data given by:

where r and s corresponds for each row r and column s entry and n is just the total number of trial images. Finally, we compute for the linear discriminant function f for each class i. pi is ni/n.

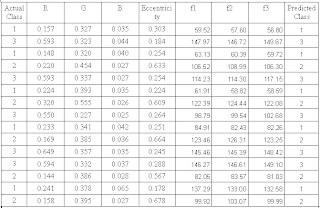
The highest fi corresponds to the class where the image belongs. We do this for the 15 remaining images in the test set. The table below is the summary of the results.

Like the previous method, we have successfully classify all the 15 images. The success rate is 100%.
I was able to successfully accomplish the activity. I want to give myself a 10.
No comments:
Post a Comment